Introduction
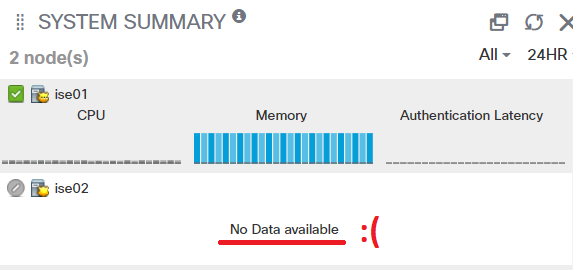
After Cisco’s redesign of the web-UI in version 2.0 of their Identity Services Engine, there has often been a bug/glitch on the System Summary section on its front page. In this section, you are supposed to see some general performance graphs of how your deployment and its is doing in terms of CPU usage, Memory-usage and Authentication Latency.
The Problem
A glitch (or bug) causes one, some, or all of the ISE-nodes in the deployment to simply display “No Data available”, and most often it could be resolved by rebooting the ISE-node that is unable to display its performance metrics with the reload command in CLI.
But sometimes a simple reload is not enough to fix the graphs, and you will have to resort to some other workaround or contact Cisco TAC. In my experience though, this glitch/bug has been present for many versions of ISE dating years ago, and it still exists today in ISE 2.7 (which would be the most go-to version of ISE to deploy today at the time of this writing, even though version 3.0 and 3.1 technically have been released).
The Solution
This workaround is only possible in ISE version 2.6 or later!
One quick-fix for this issue is to change a certain checkbox under Administration > System > Settings > Logging > Log Settings and uncheck the box Use “ISE Messaging Service” for UDP Syslogs delivery to MnT and finished by clicking on Save.
I’m not 100% sure why this checkbox solves the “No Data available” issue, but according to this post on the Cisco forum, there have been changes made between different ISE versions to how other ISE-nodes are sending logs and other data between each other. ISE-nodes require certain TCP and UDP-ports open between each other to share data successfully if they reside in different IP subnets and do not have direct connections to each other.
What is strange, is that most of the ISE-deployments I have worked with have had their ISE-nodes residing on the same IP network and without a firewall or similar filtering devices between them, and yet this problem appears.
Nevertheless, I have tried this workaround and have not yet noticed any troubles afterward.
This change can be done on a live deployment, as it will not cause a service or server restart.
After unchecking this box and clicking Save, the performance graphs should start working again after a few minutes. Sometimes only the very most recent data (latest hour) shows up and the graphs will gradually fill up as the day goes on, like on the image below.