Introduction
Check Point firewalls run Linux deep down, which means that we have access to some tools that are commonly used while troubleshooting Linux systems, one of them being TCPdump. This tool allows us to capture packets, similar to Check Point’s own fw monitor command.
I’m not going to go through all the differences between fw monitor and TCPdump, other than the result of a TCPdump is much more WireShark friendly.
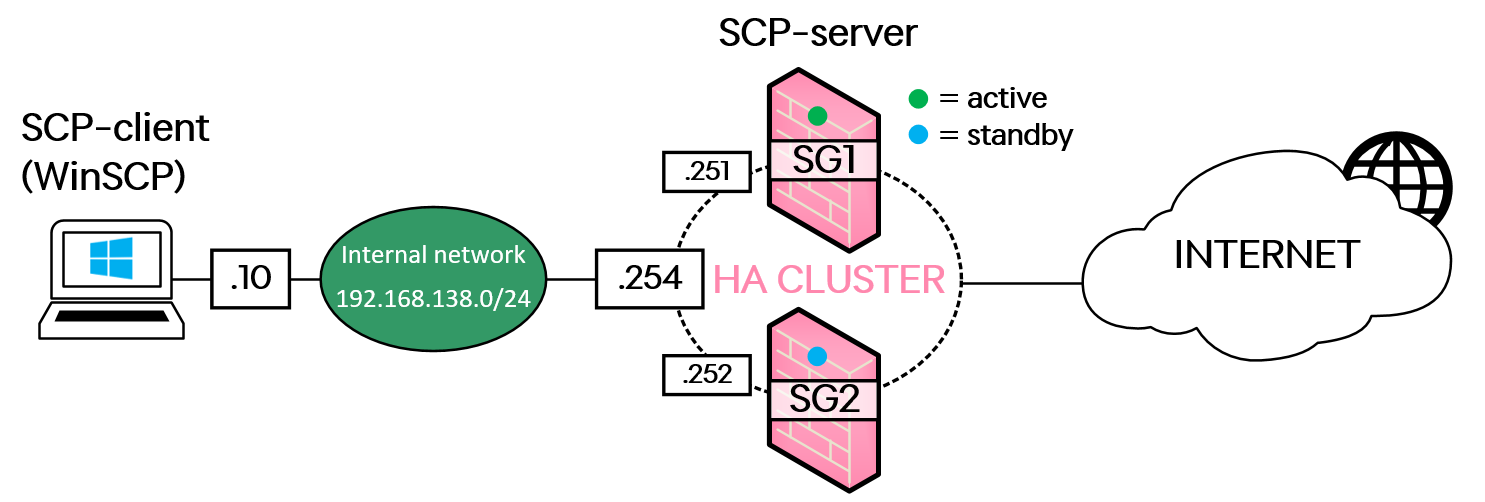
In my lab, I am running the R80.30 software version, and you can see the logical topology in the image below.
The lab environment consists of a Windows 10 PC (which will be both the source of traffic capture and act as SCP-client to extract the packet capture files from the firewall) on the internal network, and a pair of Check Point Security Gateways (firewalls) working together as a cluster with SG1 being the currently active firewall. The cluster is also connected to the internet and has basic rules set up to allow the lab-PC to access the internet, as well.
Download an SCP client
To access the SCP-server of your Check Point firewall, you will need an SCP client. I usually use WinSCP because I’m mainly a Windows user, the software is free and easy to set up. You can download it from their website (link).
Security Gateway Configuration
For the configuration of the actual firewalls, you can use either CLI or the web-GUI, instructions for both ways will follow down below.
If you have a redundant setup using clustered firewalls, make sure you are doing these steps on the firewall that is currently active, as this is where we will want the user to exist since we will be capturing traffic on this firewall.
Create a new Role for SCP-users (Web-GUI / CLI)
Gaia Web-GUI
Log into your firewall’s web-GUI and navigate to User Management > Roles > click on Add and set up the new Role as the image below shows. You only need to add the Feature called Expert Mode with Read/Write permissions and then click on OK.
Gaia CLI (Clish)
Log into your firewall using SSH and use the command below to create the SCP Role.
add rba role scpRole domain-type System readwrite-features expertCreate a new User account for SCP-usage (Web-GUI / CLI)
Next, we need to create a new user account in Gaia that is going to be used to access the packet capture files once we have created them using TCPdump.
Gaia Web-GUI
Log into your firewall’s web-GUI and navigate to User Management > Users > click on Add and fill in the information highlighted on the image below. Create a username, password and assign the correct Shell and also the correct Role, that we created in the previous step.
Gaia CLI (Clish)
Log into your firewall using SSH and run these commands to create a new user account and assign it to the SCP Role.
add user scpAccount uid 666 homedir /home/scpAccountset user scpAccount realname Scpaccountadd rba user scpAccount roles scpRoleset user scpAccount password<type in a password>save configCapture some traffic using TCPdump
The actual capturing of traffic cannot be done in the web-GUI, so head into CLI and go to Expert-mode. Now, there are thousands of ways to specify what kind of traffic you want TCPdump to capture, and you can find the syntax for these commands by searching the web, as I am no expert.
To make things simple, navigate to the home directory of your newly created user scpAccount and run the packet capture from there, which will also save the resulting packet capture file here and ready to be picked up using SCP later.
You can do this using the command:
cd /home/scpAccount/As for the packet capture itself, I am going to capture HTTPS traffic from my lab PC heading out towards the internet using this string:
tcpdump -nnvvS src 192.168.138.10 and dst port 443 -w websurf.pcap -s 0Just as a note, the parameter “-w” makes the system write the output to a file (which I named “websurf.pcap"), and the parameter “-s 0” (that’s a zero, by the way) changes the possible size of the capture to infinite, meaning you will get the full information of your captured packets and nothing will be left out due to size limits.
After starting your TCPdump, you can see a live counter showing how many packets have been captured so far.
To finish the packet capture, press Control + C. You will see a final counter displaying many packets that have been recorded in the file.
We can see that the file has been created by listing the files in the current directory:
Accessing the packet capture file using SCP
Now that the packet capture is done, all we need to do is grab the file from our Windows 10 PC and launch it in WireShark to see the content.
Start WinSCP, start a new session by selecting the SCP protocol in the dropdown list and pointing it towards the IP address of the active firewall (192.168.138.251 in my case) and log in using the username scpAccount and its password. Do note that the username is case-sensitive!
You should now be able to see that packet capture file that was created and transfer it to your PC, and then open it using WireShark.
Important notes!
If you are instead doing a TCPdump on your Security Management Server, I have run into some issues where I have needed to change the permissions on the file (or directory) that contains your capture file. Use chmod 666 <filename> or chmod 777 <filename> to increase the permissions, but do note these are very generous permissions and should be changed back to their original state after you are done.
Be aware that TCP port 22 (which the SCP protocol uses) needs to be permitted from your SCP-client machine to the firewalls’ IP address in the Security Policy that is installed on your firewalls, otherwise the SCP-session will be blocked!
You may need to disable SecureXL (using the command “fwaccel off” ) to get ALL packets captured while TCPdump is running, be sure to understand can be major performance issues while SecureXL is disabled! There are solutions to disable SecureXL only for certain traffic flows, look that up!